5 Jul 2024
Table of Contents
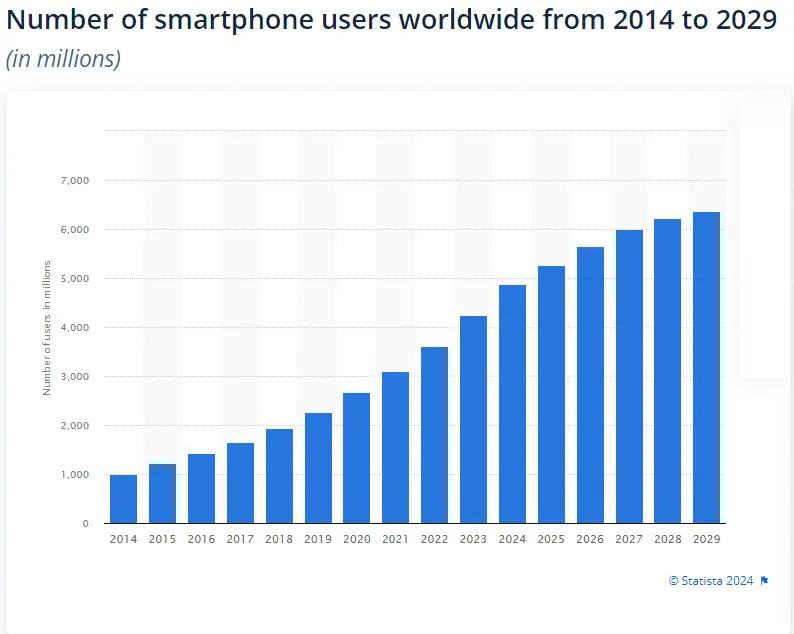
With more than 6.5 billion users of smartphones and a growing number of mobile apps, the mobile app market is certainly going to be up. Smartphone and app usage continue to grow in a steady manner with no indication of slowing down. Add in 1.14 billion users of tablets across the globe, and an increase of around 36% in the past six years. This shows the mobile app growth over the years.
If you have a moment to glance up at your phone, you’ll observe that everybody else has their eyes on the phone today. Indeed, research shows how the majority of Americans check their phones 262 times a day! This is about once every 5.5 minutes.
This is good news for app creators and all those who desire to connect with an enterprise mobile app development company. However, to succeed in this field there are two essential things that must occur.
- Users must install your application.
- Users are required to download the application.
These two seemingly easy actions inspired my writing this article. We know that users use apps to their advantage more frequently than ever before. However, that’s barely scratching the surface of the available data about the use of apps. It’s impossible to design an application based on the data alone.
Make use of the knowledge that has been written for in this mobile app development guide. This can aid you in your efforts to create or enhance your mobile application.
How Acknowledging Mobile Statistics Can Help Your Business?
There is a growing demand for mobile solutions. The ability to have everything one needs at their fingertips makes the mobile app development market quite a growth opportunity. Below are the facts indicating the current need and the latest innovations in the mobile app market. These stats come from the best mobile app development company in USA.
To be successful in the digital marketplace, you need to be aware of the needs of customers and make an impact. Mobile statistics can help you satisfy your customers’ needs and remain ahead of your competition. Additionally, with the aid of statistics on mobile phone, you will be able to understand the future of mobile apps:
- Find out how you can reach the people you want to.
- Examine the statistics of smartphone use and compare them.
- Give your audience customized and positive experiences.
- Learn about the needs and wants of your prospective customers.
- Learn how to boost the visibility of your brand using mobile marketing, and build your customers’ loyalty.
Information on how people utilize their mobile devices can help you to better understand the behavior of your customers and habits better and improve your services and products. Implementing the mobile marketing strategy more effectively can help you distinguish yourself from your competition.
A study suggests that smartphone usage is predicted to grow up to 4.74 billion at the end of 2025 which is an estimated 2.2 percent increase annually. If we examine the rise in smartphone users between 2013 through 2025, the average increase is 6.2 percent per year.
Worldwide Marketplace
In the event of competition between Android as well as iOS cellphones, Android mobile users indeed dominate the app development market, with 69.7 percent of market values according to the study carried out on Q3 2023.
If we see the US market in the analysis of Android and iOS mobile users, the iOS mobile market sees some reduction of 57.3 percent in Q3 2023 and the later one of 56.4 percent in Q3 2023 but still leads the market. In the case of the UK mobile app market and market players, the iOS and Android markets are in close competition with one another. The Q3 report in 2020 Android smartphones were dominant with 53% of the user base. In the Q3 2021 survey in 2021, it was the iOS smartphone user base recorded at 51.6 percent and the Android users base was at 47.8 percent share.
In the most recent study Q3 2023, there were 51.3 percent iOS users, and 48.1 percent Android users. It seems like there’s a chance to go for native Android as well as iOS mobile app development services USA using technology such as Flutter, or React Native.
With this kind of forecasting it makes sense for businesses to develop an application that is mobile to get their message out to the most possible customers.
Downloads Worldwide
All over the world, people use tablets and smartphones and this is why the demand for hybrid mobile app development is getting up.
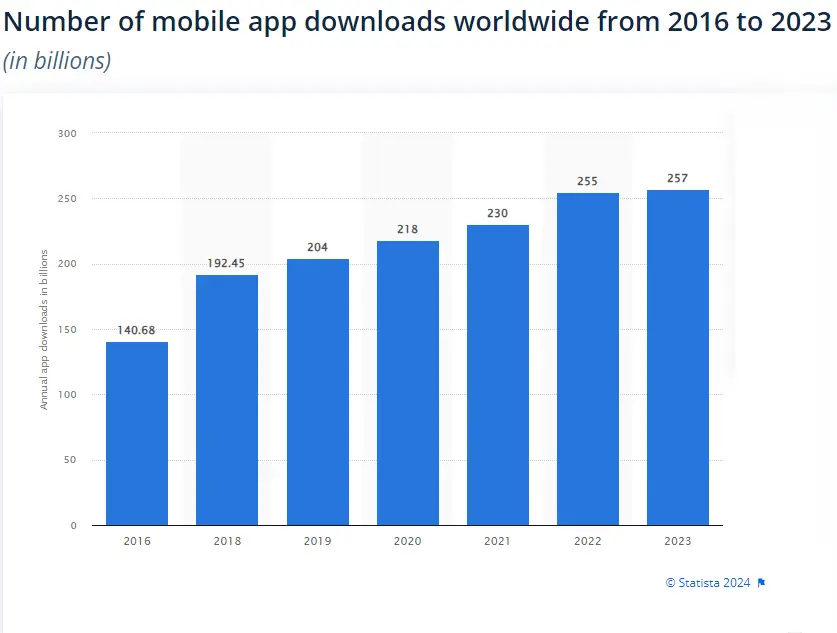
As the use of mobile apps is increasing in popularity, the amount of app downloads around the world grows as well.
We’re seeing an increase in downloads of apps each year. This trend is expected to continue in the years to come.
In the year that ended in December it was greater than 218 billion downloads of apps. This represents a roughly 77% rise over the previous year.
You can observe in the graph that there was an increase of 55% from the years 2016 to 2020. The year-over-year rate of growth isn’t quite as fast but it’s still increasing.
Downloads: Free Vs. Paid
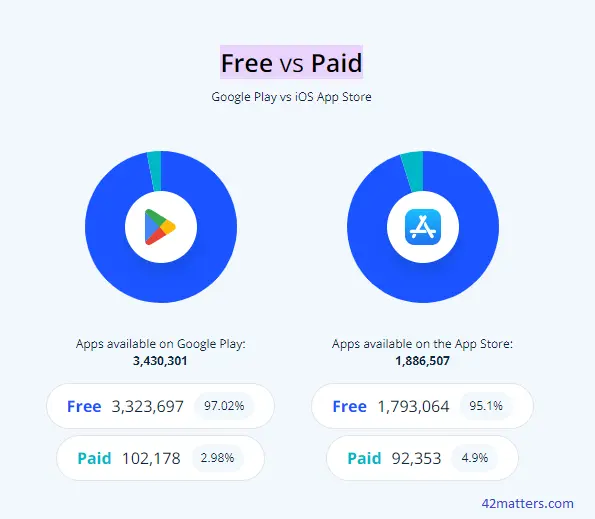
In reality 98 percent of the revenue generated by mobile apps worldwide is generated by free apps. A tiny fraction of people will purchase downloads.
If you charge users for downloads at first, less mobile users will install the application. The reason is that the majority of users are used to getting free downloads.
Look at your smartphone. Are there any apps that you have paid for? You’re not alone in the event that you do.
However, users who use pay-per-use apps have a higher chance of being involved. They don’t want to purchase something for money and then not use it as per the top mobile app development companies in USA.
However, you don’t have to charge download users to make money from your application.
If you run a business that is already established and run an application that functions as an extension of your company to enhance the customer experience, you should consider providing free downloads.
As per Android app development agency, mobile app users shouldn’t have to pay for downloading. This is due to the fact that the majority of the apps in both the Apple App Store and Google Play Store are offered at no cost.
If you’re not launching your app that is a brand new venture, you can earn money by offering your application at no cost. There are many other ways to earn money, including making in-app purchases.
If your app is used to market products or services take a look at the most current mobile e-commerce revenue and usage figures.
100+ Mobile App Statistics for You to Know Before Moving Ahead
Below are the stats showcased by the top mobile app development firm experts to give you an idea about the mobile app growth.
Mobile Usage Statistics
Statistics on mobile usage will provide a broad overview of the subject without delving into details. It is possible to learn about the use of mobile devices and usage patterns through the statistics. You can gain insight into your company and gather valuable data by looking up the statistics on mobile usage. Below are some facts regarding mobile use:
1. On average, users use devices on mobiles on average for longer than 4 hours every day (Gitnux).
2. The number of mobile users that are unique has been growing by 2.7 percent per year. Meanwhile, over the previous 12 months, hundreds of millions of people have also upgraded from “feature” phones to smartphones (DataReportal).
3. A total of 3.6 billion users were using social media via their smartphones during the year 2020 ( Gitnux).
4. The volume of data traffic through mobile networks was up 33% in the period between Q3 2022 to Q3 2023 (Ericsson).
5. With 5.60 billion “unique” mobile users by October 2023, mobile phones are used by more than two-thirds of the world’s population (DataReportal).
6. Mobile devices are utilized to complete 58 percent of Google search results (Research.com).
7. Over the previous twelve months there was a 45 million increase in the total of smartphone users (DataReportal).
8. More than 90 percent smartphone users access their phones during the first half hour of starting online (Gitnux).
9. In 2029, by the time it is over the monthly global mobile data usage is predicted to be 56 billion (Ericsson).
10. In January 2021 there were 5.22 billion unique mobile users around the world (Gitnux).
11. Video traffic is expected to comprise 73 percent of mobile internet traffic before 2023 ( Ericsson).
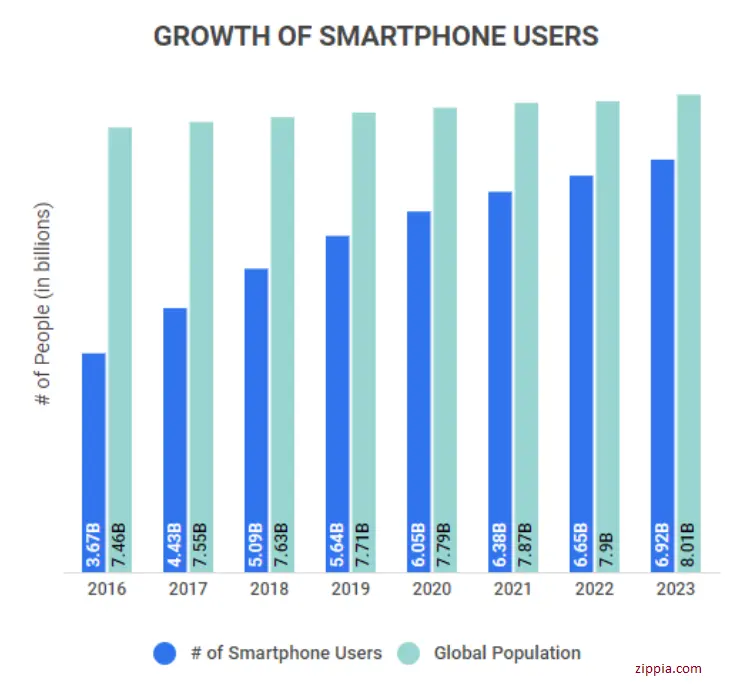
12. By 2023 there will be around 270 million Americans, approximately 81.6 percent of the populace who own smartphones (Zippia).
13. Seven countries spend over five hours a day on a mobile screen. In addition, 18 countries under review outperformed 3rd quarter 2021 mean for 3 hours and 43 minutes (Exploding Topics).
14. Globally, there are approximately 6.92 billion smartphone users. In 2023 this will be 86.29 percent of the total population (Zippia).
15. Given that half of screen time sessions begin with the three-minute mark of the last, using your phone could become a habit (Exploding Topics).
16. The average American uses his mobile more than 96 times in a day, or every 10 minutes (Zippia).
17. 11% of respondents are said to use their phones for longer than seven hours a day. Additionally only 5 percent of Americans reported using phones less than one hour every day (Exploding Topics).
18. In 2023 78 percent of American young people watched videos on their phones at least once per every week (Demandsage).
19. The amount of smartphone users in the world has increased by an average annual rate of 6.2 percentage from 2013 to 2025 with the highest growth occurring in 2014. There was a 20.9 percent increase in smartphone users during that year (Oberlo).
20. In the US Smartphone users in the US touch their phones 2,617 times a day per day on a basis (Demandsage).
Mobile App Usage Statistics
There are many applications that are accessible on tablets and smartphones that are utilized in different categories and with different reasons. Mobile survey of apps and mobile usage statistics of apps let you know the kind of apps that users are using, how long they are using these apps and the way their usage affects their lives. Here are some helpful data on mobile app usage for you to study as suggested by the top mobile app development agency:
21. Just 11 percent of the time of smartphone users is spent on websites; 89% of their time is used for apps (Gitnux).
22. In 2022, 3.8 trillion hours were spent with mobile applications (MobiLoud).
23. The average American smartphone user has more than 100 apps installed on their phone ( Gitnux).
24. Although only 65.7 percent of women between 55 and 64 said they used chat apps to work The women who were between 16-24 were the most frequent users of these apps (Statista).
25. In 2025, mobile applications are predicted to earn more than $935 billion in revenues (buildfire).
26. According to a poll that was conducted, messaging and social media apps are in the top three apps categories that users are spending the most time in and which 49% saying. According to the survey of 2019, 26% of respondents expressed a similar opinion about game applications (Statista).
27. Social networks are among the top apps that are used by more than 70 percent of young people (MindSea).
28. 38 percent of US custom mobile app development services experts for gaming offer their games through the App Store as well as Google Play (42Matters).
29. Since 2016 the amount of apps that are available to download globally has increased by 82 percent (MobiLoud).
30. In 2019 it was predicted that more than 204 billion mobile applications will be downloaded from mobile devices (Gitnux).
31. In a survey on the use of mobile apps by age that was conducted in the second quarter of 2022 94 percent of male users aged 16 to 34 claimed they utilized applications for business using mobile phones (Statista).
32. Thirty days after installing an Android application, 2.6% of users will be using it. On iPhones this figure is 4.3 percent (MobiLoud).
33. A smartphone user typically is able to have Between sixty and 90 applications installed on their phone (Kurve).
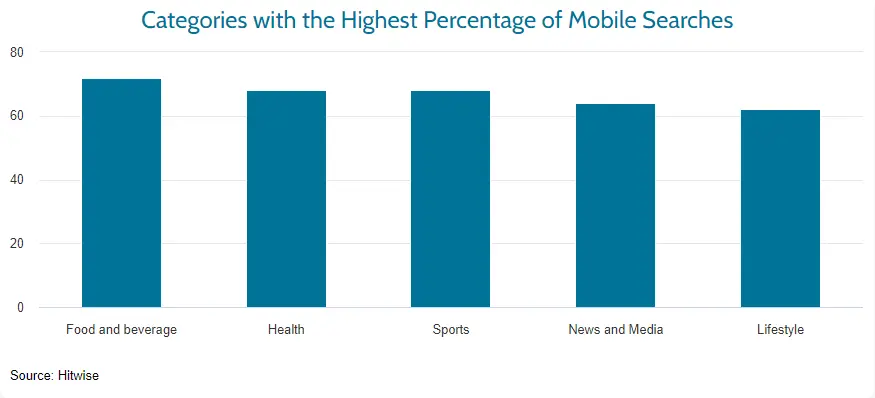
34. By category, apps for sports had the largest number of male users with 94 percent in comparison to health and fitness apps had the highest percentage of female users with 63 percent (Business of Apps).
35. A survey in 2022 revealed that, globally, gamers aged between 20 and 29 logged on average 19.7 minutes each day playing action games, while they played 15.4 minutes per day playing casual games. The younger gamers have higher overall engagement levels when it comes to the mobile game (Statista).
36. A website with poor mobile user experience can reduce the trust of people using smartphones by 50 percent higher than an application (Gitnux).
37. In 2021 alone, 2 million new applications were created (MobiLoud).
Mobile App Marketing Statistics
Monitoring the latest mobile app development trends can help you develop the best strategies for your business. When you are able to design your mobile marketing strategies you can boost your brand’s visibility, improve the loyalty of your customers, and boost the amount of sales you make by interacting with the appropriate audiences. To make it easier for you to understand the importance of mobile marketing, here are a few mobile marketing facts provided by the cross platform mobile app development company:
38. All industries together have the average rate for mobiles of 3.48 percent in the year 2019 (Gitnux).
39. 90.09 percent of businesses that use SMS marketing believe it’s an effective marketing strategy (SimpleTexting).
40. The US is expected to invest 61.3 percent of its total budget for digital ads on mobile advertising by 2021 (Gitnux).
41. In the app stores by 2021, 320,000 dollars were spent each minute (MobiLoud).
42. 2023 witnessed an increase of 56% on the number of people who use SMS for marketing, year over year with 86 percent of business owners as well as marketing managers reporting they’ve text-based clients with the approach (SimpleTexting).
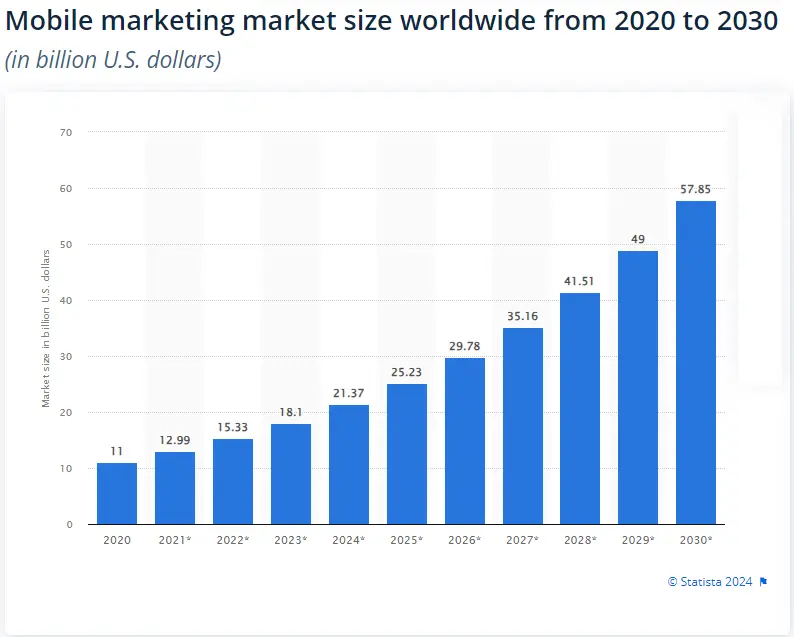
43. The size of the global mobile marketing campaign has been 11.25 billion dollars in 2020 the year of its launch, and will continue to grow up to 57.85 billion dollars by the year 2030. This suggests an annual compound rise (CAGR) that is greater than 18 percent (Statista).
44. 46% of the world’s online sales are conducted via smartphones (Gitnux).
45. Companies that use marketing messaging customers are 217.33 percent more likely to experience the success of their campaigns than companies that don’t make use of text messages ( SimpleTexting).
46. Two out of three dollars spent on mobile devices is influenced through advertising (data.ai).
47. With the 14.1 percent YoY growth the mobile ad campaign revenue reached an all-time high of 154.1 billion dollars by 2022. That’s a 73.5 percentage of all online ad revenue (IAB).
48. The market for marketing via email worldwide is estimated at 7.5 billion dollars as of the year 2020 and, by 2027, it is expected to expand to 17.9 billion. In the next few years it is expected to grow by 13.3 percent compound increase (CAGR) is predicted (Statista).
49. When using SMS marketing, 81%of business owners and marketing managers can also integrate SMS into HubSpot, Mailchimp, Salesforce and other platforms for marketing as well as platforms ( SimpleTexting).
50. 72% of smartphone, computer tablet and smartphone owners would prefer the concept of location-based marketing (LLCBuddy).
51. By 2024 the amount that mobile marketing is spending will be more than the 413 billion dollar mark (Luisa Zhou).
52. 70% of Smartphone buyers are more likely to buy from a company when its mobile-friendly website or application facilitates quick payments (Moengage).
53. 63 percent of people who use smartphones are likely to buy from businesses that have ideas for apps or websites that offer relevant recommendations and offers (Semrush).
54. It is anticipated that the United States will spend more than 240 billion dollars on mobile marketing (Luisa Zhou)
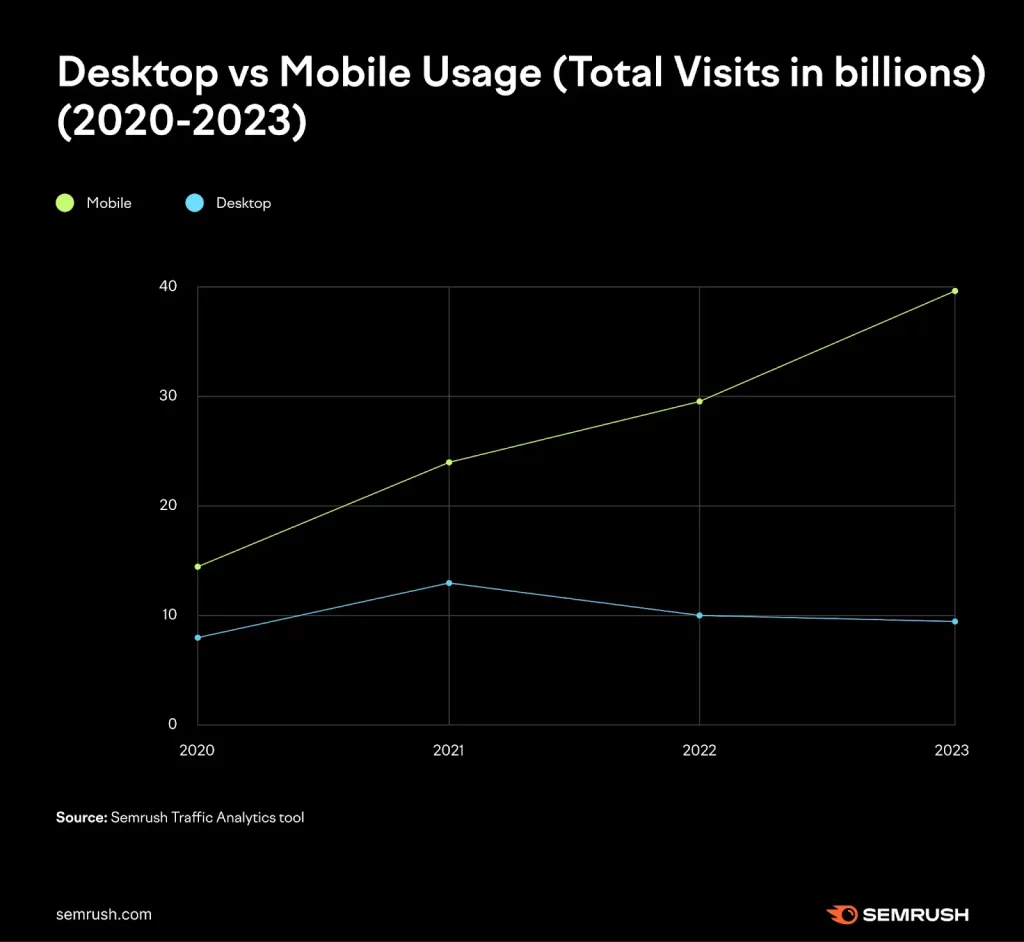
Mobile vs. Desktop Statistics
Mobile and desktop statistics enable you to study the spread of internet usage and user experience across different platforms. By comparing mobile as opposed to desktop statistics, you can observe the difference in the use of both platforms and compare them. Below are the desktop vs. mobile data to help you get a better understanding:
55. 95 percent of Internet users around the world are on the internet at least in part on mobile devices (DataReportal).
56. Compared to desktop web browsing or websites designed for smartphones, best apps in USA provide higher engagement rates (Techjury).
57. In 2019 Desktop users had a conversion rate of 4.14-44%. However, the ratio for tablets was 3.36 percent and the conversion ratio for smartphone users was 1.53 percent (Research.com).
58. In Canada, 56 percent of people would rather use desktops over mobile phones, while only 39 percent make use of Desktop computers (Kinsta).
59. According to research from the United States, 5% of the emails viewed in 2018 were opened from computers on desktops, whereas 61% of emails were opened on phones (Research.com).
60. In 2023 the year 2023, 49% of marketing spending was devoted to desktops, while 51% of it was spent on phones (Luisa Zhou).
61. In comparison to mobile and desktop, the average price on desktops is 40 dollars higher (Tidio).
62. With an average traffic share of 54 percent, mobile devices are more popular than desktops as the most used device to access the internet (Kinsta).
63. In 2019 mobile device traffic accounted for 50.48 percent of all traffic on the internet. However, 46.51% of all traffic on the internet came through desktop computers (Research.com).
64. By 2022 39.34 percent of traffic to websites was generated by computers and tablets, as opposed to 60.66 percent of smartphones (Techjury).
65. Around 53% of all global internet activity and 57% of all online time is now attributable to the mobile device (DataReportal).
66. The average number of websites used by desktop users is 3.95 which is lower than 2.67 on mobile devices, and 3.21 tablets (Neil Patel).
67. In 2021 smartphones were responsible for 55 percent of all views on websites (Techjury).
Mobile App Statistics By Vertical
The growth of online purchasing across the globe has allowed smartphones to take on a significant role in this area. Many brands make their sales using mobile devices via the internet. Because of this, mobile commerce statistics enable your company to observe and analyze consumer preferences in this field. Here are the most important mobile commerce data as per the top iOS app development agency:
68. 42% of customers search for and book travel accommodation through phones (Gitnux).
69. The proportion of mobile online shopping has steadily increased from 56 percent in 2018 to 62% by 2027 (Statista).
70. In 2023, sales from mobile commerce exceeded 415.93 million dollars or 6 percent of the retail sales (Forbes Advisor).
71. Mobile devices were utilized to end sales in 58 percent of all purchases made with multiple devices that were made between the years of 2021 (Research.com).
72. In 2022, 1,419 games and apps earned more than the amount of 10 million dollars. Ten made more than $1 billion dollars in revenue. Meanwhile, 224 more than 100 million dollars (Udonis).
73. In 2024 mobile commerce is expected to comprise 44.6 percent of all e-commerce retail transactions in the United States (Insider Intelligence).
74. Sales of mobile e-commerce reached 2.2 trillion dollars by 2023 and accounted for 60% of all global eCommerce sales, according to the Statista market Insights (Statista).
75. 78% of mobile data traffic in the world is expected to be generated by mobile video content in 2023 (Gitnux).
76. In 2023 online shopping is expected to make up 20.8 percent of total retail revenue (Forbes Advisor).
77. 54% of transactions made via mobile commerce are done using specialized applications that are the main method of making online purchases (Tidio).
78. In 2025, it’s predicted that 710 trillion dollars of sales will be generated by online commerce (Forbes Advisor).
79. The US is predicted to spend 61.3 percent of its total budget for digital ads on mobile advertising by 2021 (Gitnux).
80. The sales of mobile commerce within the US are predicted to hit 558.29 milliards of dollars before 2024. That will make up 7.4 percent of merchandise sales (Insider intelligence).
81. A site that’s not mobile-friendly is likely to lose 61% of its users (Luisa Zhou).
82. Smartphones are the preferred choice of 49% of mobile buyers to evaluate prices for products or services (Tidio).
83. The market for e-commerce is expected to increase to the value of 8.1 trillion dollars in 2026 (Forbes Advisor).
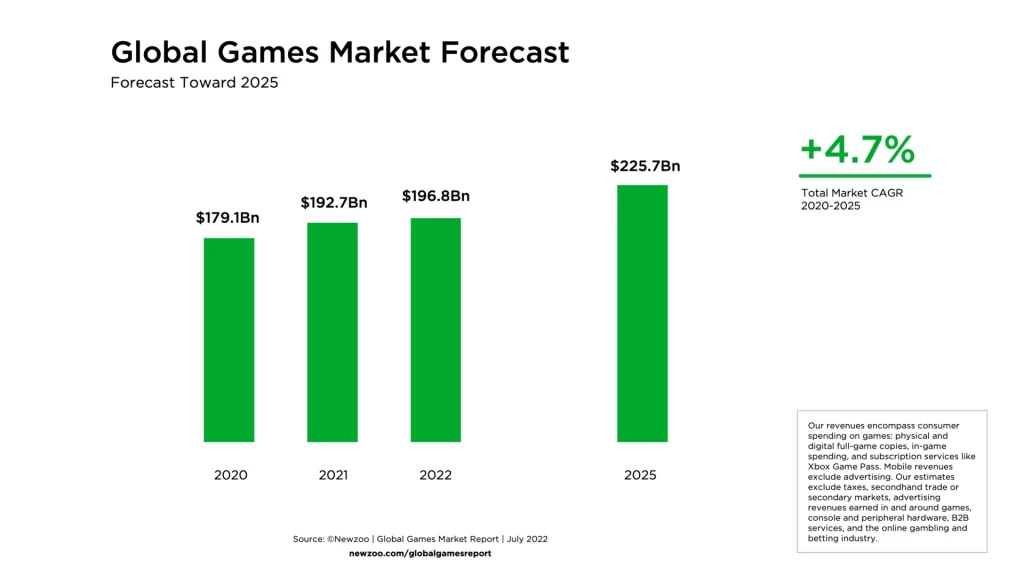
Mobile Gaming Statistics
Mobile games have become a popular entertainment activity due to the widespread use of smartphones around the world. Gaming has brought rapid mobile app growth, with players of all ages increasing daily. You can use mobile gaming statistics to help you develop your marketing strategy. Here are statistics on mobile gaming:
84. In 2019, mobile gaming accounted for 60% of all video game revenues worldwide (Gitnux).
85. The mobile game market share stands at 50%, or 92 billion dollars, out of the 184 billion dollars that will be generated by all sorts of games in 2022 (Udonis).
86. In 2023, the market for mobile gaming will be worth 172.10 billion dollars worldwide (Zippia).
87. According to mobile games producers, competition is the biggest challenge for the industry, with 73.1% of the total (Go-Globe).
88. The Philippines came in second with a rate of 77% for mobile gaming. With a rate of 77% for mobile gaming, the Philippines came in second (Statista).
89. In 2022, revenue from mobile games was 92 billion dollars, with a 6.4% YoY decrease (Udonis).
90. More than 155 million people from the United States play mobile games, representing more than 46% of the people from the US (Zippia).
91. In Q4 2022, 295,676 mobile games were available on the App Store (PlayToday.co).
92. 64% of the people who play mobile games are between the ages of 18-34 (Zippia).
93. A projected 270 billion dollars in revenue will come from mobile gaming by 2030, accounting for more than 50% of the worldwide games business (LinkedIn).
94. On Android, there are about 500,000 mobile game applications available (PlayToday.co).
95. Men make up only 45% of mobile gamers, compared to roughly 55% of women (Zippia).
96. The revenue from mobile games advertising sports games will fall by 14% in 2022 (PlayToday.co).
97. About half of American mobile gamers (51%) used iPhones for gaming as of October 2022, while 40% of respondents used Android smartphones (Statista).
98. Playing mobile games takes up 8% of all mobile time (Zippia).
99. It is expected to rise to around 7.9 billion dollars by 2024 (Statista).
100. Globally, there are 2.2 billion mobile gamers (Udonis).
Final Thoughts
There are plenty of opportunities in the rapidly growing app economy across the globe, enduring success requires continuous efforts to grow hack analytics, optimizations and analytics. The above statistics offer a brief but important glimpse of the factors that will drive advertising on mobile apps, retention of users, and monetization by 2024. A thorough analysis of these areas will aid in navigating the ever-changing business landscape in a profitable way. A3Logics is the right choice if you are looking for a custom mobile app development company in the USA, to assist you with mobile app growth and development. Good luck!
Frequently Asked Questions
What is the rate of success in mobile app development?
About 10% of apps can maintain engagement and revenue beyond the initial 3 months revealing the challenges of achieving sustained success on a large scale.
What are the top mobile app development services providers within the USA?
Review portfolio quality, customer reviews, experiences across different niches, transparency in pricing Expertise and certifications. Recommendations from clients will help you narrow down the top US-based app developers. If you are looking for the leading mobile app development company in the USA, A3Logics can be your top choice. Good luck!
What is the average usage of apps per day?
According to global surveys, users spend around four hours a day using mobile devices, with more than 75% of their time spent in apps. It varies based on the demographics, but it tends to be half of the day being spent actively making use of mobile apps.
Table of Contents


Kamal Kishore
Kamal Kishore crafts innovative digital marketing strategies that drive growth, engagement, and brand success. His expertise in market trends and audience behavior ensures impactful, results-driven campaigns.