1 May 2025
Power BI vs Tableau: In a digital world that is becoming faster by the day, data is available everywhere and, in fact, growing every second. But data in itself is not quite enough! To be in a position to make smarter decisions, find hidden insights, and stay an edge ahead of the competition, businesses need to know their data. This is precisely where the BI tools come in.
Deep into 2025, BI tools have evolved from being optional enhancements to essential instruments for data-driven decision-making. They can unravel complex data and convert it to simple dashboards and interactive reports so that teams can make decisions quickly and better.
BI tools are involved in many ways a business can perform across industries, from understanding customer behaviour to tracking KPIs (key performance indicators), forecasting future trends, and so on.
Among the many tools, Power BI and Tableau are definitely leaders in the field of BI. They both tools provide powerful and easy-to-use platforms with perfectly strong data visualization capabilities and extensive analytical functionalities. Microsoft Power BI is lauded for its smooth integration with other Microsoft products and competitive pricing for such a powerful tool.
Tableau, now with Salesforce, has made a name for itself through an easy and flexible user interface with data and amazing storytelling.
This article will talk about the definite reason BI tools are a must in 2025 and how Power BI and Tableau are on the boundaries of changing data into actionable insights.
Table of Contents
What is Power BI?

Microsoft has steadily developed and maintained the most powerful business intelligence tool, Power BI, helping all types of organizations to transform raw data into clear, visually appealing insights. The tool was launched in 2015, Power BI quickly gained traction in the BI landscape, thanks to its intuitive interface, robust visualization capabilities, and seamless integration with other Microsoft services like Excel, Azure, and Teams.
Essentially, Power BI is the software service component that, in conjunction with its apps and connectors, allows the transformation of disparate data sources into usable interactive dashboards and reports. Power BI connects, cleans, analyzes, and visualizes data from scattered sources through the same interface, whether the data itself is in an integrated database application, any cloud service, or simply in a text-based file.
Key Use Cases of Power BI
Power BI is widely used across various business functions and organizational levels. Some of the most popular use cases include:
- Sales and Marketing Analytics: Analyzing campaign effectiveness, measuring sales pipelines, and examining consumer behaviour.
- Finance and Accounting: Develop real-time dashboards for financial reporting, budgeting, and cash flow analysis.
- Operations and Supply Chain: Maintain inventory levels, optimize logistics, and improve operational efficiency.
- Human Resources: View workforce trends, monitor employee productivity, and analyze recruitment success.
- Executive Dashboards: Offer leadership a top-down view of key performance indicators (KPIs) and business performance metrics.
Industries That Use Power BI
Various industries find the usage of Power BI indispensable due to its flexibility.
- Retail and eCommerce: Analyze consumer buying behaviour, inventory management, and demand forecasting.
- Healthcare: Tracking modules for patient data, hospital performance, and outcomes.
- Banking and Finance: Risk management, transaction monitoring, and regulatory compliance purposes.
- Manufacturing: Production planning, equipment monitoring, and quality control.
- Education: Student performance evaluation, institutional data management, and resource consumption tracking.
- Government: Transparency reporting, public services data analysis, and internal operations management.
Due to its robustness, great scale, and affordability, Power BI is reasonably becoming a go-to choice for small and large companies that are willing to become truly data-driven by 2025.
What is Tableau?
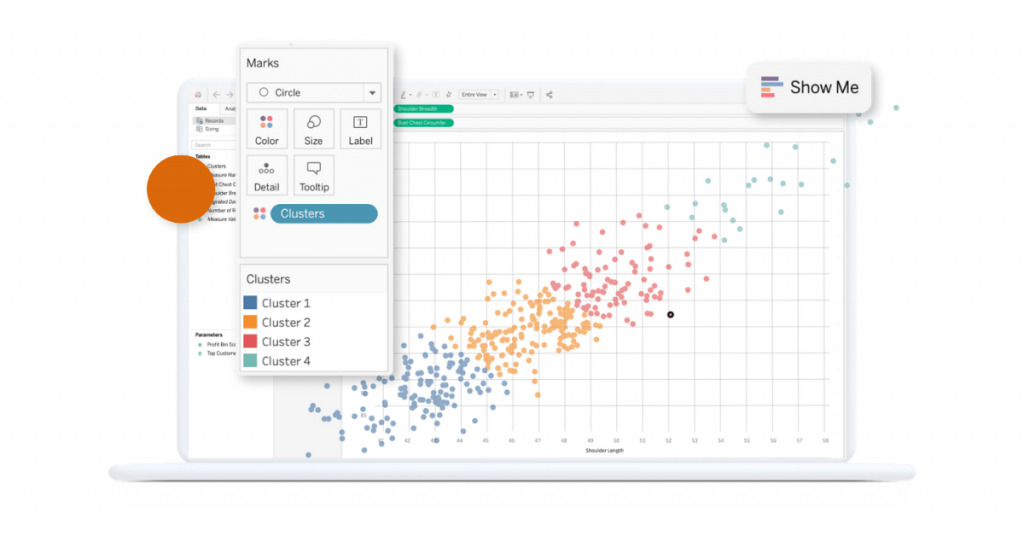
Tableau is a helping tool for business intelligence (BI) and the design of many attractive visualization end-points that enable people to see and understand their data. The tool was launched in 2003, and since then, it has been purchased by Salesforce in 2019. As of now, it is credited with enabling any typical person to convert his or her raw data into rich interactive visuals with just a few clicks without writing any code at all.
At its heart, Tableau allows you to connect to different data sources, process them, and formulate dashboards for building rather simple but differing stories. With a drag-and-drop interface, anyone- from techies to non-techies- can explore data and generate insights in no time. It’s your spreadsheets interlinked with cloud databases, even big data platforms, in a world where complex data are accessible and actionable.
Key Use Cases of Tableau
- Performance Monitoring for Business: Real-time monitoring of KPIs and performance metrics in the departments.
- Customer Analytics: Analysis of customer journey-behavior models and satisfaction trends to enhance marketing and support.
- Create dynamic financial dashboards that can be used in budget tracking, forecasting, and profitability analysis for financial reporting.
- Data Exploration and Storytelling: Narratives that are visually represented for stakeholders to use in insight into emergent trends and patterns in the organization.
- Survey and Feedback Analysis: Insight into qualitative and quantitative data gathered from surveys by disaggregation.
Industries That Use Tableau
Tableau is incredibly versatile and has a wonderful visualization tool, and also serves multiple industries, such as:
- Healthcare: For the analysis of patient data, health quality, and operational efficiencies.
- Retail: Understanding sales trends, consumer preferences, and inventory movements.
- Education: Student performance, institutional metrics, and administrative data.
- Finance and Insurance: Risk assessment, portfolio analysis, and compliance with regulatory standards.
- Technology: Product performance, customer feedback, and agile tracking of projects.
- Public Sector: Transparent visualization of data for public reporting and internal use in the decision process.
By 2025, Tableau’s visual-first approach and flexibility would guarantee that it would widely accept data analysts, business users, and executives alike by rapidly adopting fast, visual insights for driving data-smart decisions by organizations.
Key Difference Between Power BI and Tableau
When choosing between Power BI vs Tableau 2025, it’s important to understand how each tool stands out in terms of usability, Power BI and Tableau features, cost, and overall value. Both are excellent BI platforms, but they serve slightly different needs depending on your business size, budget, and data goals.
| Aspect | Power BI | Tableau |
| Developer | Microsoft | Salesforce |
| Ease of Use | Very beginner-friendly, especially for Excel users | Easy for users with some experience; more flexible for deep analysis |
| User Interface | Clean and integrated with Microsoft tools | Highly visual and drag-and-drop focused |
| Data Visualization | Strong visuals with good customization | Industry leader in advanced and interactive visualizations |
| Integration | Best with Microsoft products (Excel, Azure, Teams, etc.) | Broad support; integrates well with a wide range of data sources |
| Performance with Big Data | Good, but can slow down with very large datasets | Handles large and complex datasets more efficiently |
| Pricing | More affordable, especially for small to mid-sized businesses | Higher cost; better suited for enterprise-level users |
| Deployment Options | Cloud-based (Power BI Service) and on-premises (Power BI Report Server) | Cloud, on-premises, and Tableau Online/Server for enterprise deployment |
| Learning Curve | Relatively easy to learn and use | Moderate; more features mean slightly steeper learning curve |
| Mobile Support | Strong mobile apps with dashboard viewing | Also strong; very interactive on mobile devices |
| Customer Support & Community | Large Microsoft support and active community | Strong community and customer support through forums and Tableau Public |
| AI & ML Features | Built-in AI tools like Q&A, Quick Insights, and integration with Azure AI | Offers forecasting, trend analysis; integrates with Python and R |
| Customization & Flexibility | Less flexible in deep-level customizations | Highly customizable and powerful for advanced users |
The Power BI vs Tableau comparison is a quick view of how both act on different sets of needs. In essence:
- Choose Power BI: If cost is a factor, and you want ease of use and good integration within Microsoft tools.
- Choose Tableau: If you want the flexibility of the highest-quality data visualization and special treatment for large or complex datasets.

Amazing Power BI and Tableau Features
Tableau Features
Tableau stands out as a superior choice for BI when it comes to telling the data story through impactful visualizations. Here are some key Power BI and Tableau features that make Tableau a preferred tool among many organizations in 2025:
1. Intuitive Dashboards
Tableau has a reputation for its drag-and-drop dashboard designer that lets anyone create stunning visualizations without any coding experience. Joining charts, maps, tables, and filters into one interactive dashboard is an easy process. These dashboards help users gauge patterns, trends, and insights at a glance—making data analysis not just efficient but also fun.
2. Real-Time Analytics
Probably the best thing about Tableau is its real-time data analysis. Be it streaming from a live source or getting stored in a cloud service, Tableau has everything in it. New incoming data is tapped into with automatic dashboard updates. This allows businesses to keep an instant watch on key metrics and thus make faster and much more informed decisions exactly at that time.
3. Ease of Integration
Tableau provides simple integration with numerous sources of data, including Excel, Google Sheets, SQL databases, various cloud services (like AWS and Google BigQuery) and even proprietary APIs. It is this flexibility that enables a business to take its data from just about any source and align that data seamlessly into a single view without the requisite complicated setup.
4. Sharing & Collaboration
Because of this collaboration, the very design of Tableau lives and breathes its purpose. The ability to securely share dashboards and reports with colleagues using features like Tableau Server and Tableau Online is just an example of its collaboration. Apart from that, to make working with teams even more effective, reports may also be scheduled, permissions assigned, and comments left all within the dashboard. It’s easy for teams to work together to share data-driven decisions.
5. Mobile Accessibility
Tableau thus offers complete mobile services so that people are never disconnected from their dashboards and reports. While accessing them through a smartphone or tablet, a fully touch-supported, well-responsive interface with intense linkages would be observed by the app for mobile devices.
6. Customer Support
Multiple communication channels, an extensive knowledge base, community forums, online training, and direct support plans are available for robust customer support Tableau. There is always assistance available for beginners and advanced users alike. Moreover, Tableau has such a great user community that shares dashboards, tips, and solutions on a day-to-day basis, which makes learning and troubleshooting that much easier.
Power BI Features
Among the best of its class, Power BI is an extensive and comprehensive business intelligence tool in the market, with many features that help its users convert data into actionable insights. Beginners or experienced analysts can rely on the same power to connect, visualize, and share their data efficiently.
1. Data Connectivity
Now, Power BI can connect with hundreds of data sources, either a cloud-based source or on-premises. It includes pulling data from Excel, SQL Server, Azure, Salesforce, or Google Analytics, which are available to seamlessly bring all data together.
2. Power Query (Data Transformation)
With the help of Power Query, users can shape and clean data, and it can be transformed so that data is not used in reports. Merge tables, Filter rows, Rename columns, and many more are done without writing any code, thus saving time and making the data ready for analysis.
3. Data Modeling
Power BI allows users to create relationships between various data tables, use DAX (Data Analysis Expressions) to define custom calculations, and build powerful data models, thus making it easier to perform deep analysis and generate accurate insights.
4. Interactive Dashboards & Reports
It is on the interactive dashboards of Power BI’s core strength that users click on visuals to drill down into data, apply filters and see real-time changes. Reports are visually appealing and can be customized to suit different types of business needs.
5. Real-Time Data Monitoring
By real-time streaming, the Power BI can show up-to-the-minute data from several sources, such as IoT devices, social media feeds, or business applications. It is highly beneficial for watching operations, sales, or customer service processes in real-time.
6. Q&A (Natural Language Query)
Users can ask Power BI questions on the data in plain English through this Q&A feature. For example, “What was the total sales figure last month?” is instantly turned into a relevant chart. It’s just that simple and yet powerful for non-technical users to get at the data.
7. AI-Powered Insights
Built-in AI functionalities will help users find patterns in the data, forecast tendencies, and create anomaly alerts- all without needing to have data science expertise. With the integration of Azure Machine Learning and smart narratives, data analysis is brought to another level.
8. Mobile Access
Power BI has well-responsive mobile applications that run on iOS, Android, and Windows devices. Users can view reports and dashboard data on the go, receive push notifications on crucial updates, and even have access to the information while offline.
9. Sharing & Collaboration
Sharing reports with your teams securely over email, Microsoft Teams, or SharePoint is possible in Power BI. Using collaboration features, users can comment, tag other people, and work together in real time to speed up and ease the data-driven decision-making process.
10. Security & Governance
Security features like row-level security (RLS), data encryption, and compliance with global standards such as GDPR and HIPAA are included in Power BI. The administrator will control who will see what data, which usually includes sensitive data to keep intact.
11. Power BI Embedded
For developers, Power BI Embedded allows one to integrate Power BI reports and dashboards into custom apps or websites, enabling businesses to offer rich interactive data experiences to end customers without having to do so by writing a solution from scratch.
Tableau vs Power BI Pros and Cons : Which is Better Power BI or Tableau?
Both Tableau and Power BI are fine business intelligence tools, but they also have their own pros and cons. Hence, the choice will depend on your business requirements, the complexity of data, the skills of the team, and the cost.
Here’s a breakdown of the pros and cons of each in simple terms:
Power BI: Pros and Cons
Pros:
- Easy to utilize – In particular, for fledgling or novice users, as well as for those who have some familiarity with Excel.
- Affordable rates – It is just difficult to beat value for small to medium companies.
- Seamless Microsoft integration – Between Excel, Azure, Teams, and tons more, everything would be fine.
- AI features – With natural language query and machine learning insights.
- Robust sharing options- Easy collaboration via the Microsoft ecosystem.
- Frequent update- Improvements in features by Microsoft at regular intervals.
Cons:
- Limited visuals concerning flexibility- Customizing is way less when comparing it to its counterpart, Tableau.
- Performance with very large data sets- It might slow down when one uses complex or huge data.
- The steeper learning curve to learn advanced functionalities- Especially with DAX modelling of the data.
Tableau: Pros and Cons
Pros:
- Powerful data visualization – It’s popularly known for incredibly beautiful interactive charts and dashboards.
- Flexible and customizable – It is possible to define an appropriate design and layout.
- Great at handling large datasets – The best performance in analyzing complicated and big data.
- Good data blending capabilities – Allows several data sources to be combined easily.
- It is a great big community with a lot of learning resources, forums, and templates.
Cons:
- High cost – It is really pricier than Power BI, especially for teams.
- It takes more time to learn- Not so good for people who would otherwise be new at it.
- Fewer built-in AI features – More on integration or sophisticated set-up.
If you want a cost-effective tool that is very simple and really effective when it comes to integration with Microsoft, then Power BI is the best choice. But if power in data visualization was the most important issue for you and you were dealing with larger datasets or more complex datasets, Tableau might be the answer, even if it costs a bit more.
Power BI vs Tableau: Which Should You Choose?
The selection of Power BI vs Tableau 2025 depends upon the size of the organization, the data needs, the budget, and the technical capabilities of the workforce. While both are good BI platforms for providing insights from data, their audiences and respective use cases show a slight difference between Power BI and Tableau.
Let us simplify it for you to consider which product is in your best interest:
Tool Recommendation Based on:
Business Size:
Small and Medium Business (SMB): Power BI is usually preferred, considering that it is low-cost and easy to use.
Large Corporations: Tableau is a better fit because it deals with large-scale data and complex dashboards.
Use Case:
Standard Reporting, Quick Dashboards, Microsoft Environments: Here, Power BI will do absolutely fine.
Advanced visualization, custom reports, deep data exploration: Tableau is more flexible and powerful in this regard.
Budget:
Limited Funds: Power BI has a very decent pricing point, especially with the free desktop version and reasonable monthly charges.
Larger Fund Allocation: On the pricier end, Tableau gives high-end features and visualization prowess.
Expertise:
Beginners or Non-Technical Users: Power BI is more forgiving to learn, particularly for Excel users.
Data Analysts and Experts: Tableau gives much more in-depth functionality and customization at the disposal of advanced users.
Who Should Use Power BI?
Power BI is ideal for:
- Small-to-medium-sized operations
- Teams that are already in the Microsoft universe (Excel, Azure, Teams)
- For users needing rapid set-up and intuitively
- understandable dashboards
- Companies on a tighter budget
- Business users with little or no technical background
Who Should Use Tableau?
Tableau is a great choice for:
- Very large businesses or organizations in data-rich industries
- Team members who require visually rich and flexible analysis
- Users who are comfortable working with data analytics or any technical activity
- Organizations that require full customization and interactivity.
- Firms with a focus on data storytelling and exploration.
Power BI is the way to go if you’re looking for low-cost, easy-to-implement software with good integration within Microsoft’s ecosystem. Tableau, on the other hand, would need your bucks if you’re after high-end visuals, heavy-duty capacity with large datasets, and probably more customization over dashboarding.
Still confused? Many corporations operate both—Power BI for quick reporting and Tableau for in-depth analysis. It ultimately depends on what your priorities are in using the data.
Conclusion : Power BI vs Tableau
The transformation and selection of Power BI vs Tableau 2025 has transitioned organizations to derive insights from data and manage their operations smoothly. They have evolved from being a simple reporting tool to conducting primary catalytic activities, driving industries toward an era of faster, smarter, and more informed decision-making by 2025.
Put directly, Power BI is an excellent choice for small- and medium-scale enterprises operating within the Microsoft ecosystem. It is cost-effective, easy to use, and comes equipped with all the right bells and real-time dashboards, artificial intelligence insights, and natural language queries.
Conversely, Tableau will be the better option for established companies and data specialists who require sophisticated visualizations and free space to play with their data, not to mention an industrial-strength engine capable of handling huge and complicated datasets. Having been aesthetically utilized for thorough data exploration and visual storytelling.
Both tools boast their comparative advantages in their own right but happen to be well-created for the opposite ends of the spectrum. Hence, the particular choice will depend on clearly defined requirements and budget, the skills available within the working group, the size of the organization, and the nature of the data under consideration. In many cases, leveraging expert Power BI Consulting Services can help organizations make informed decisions based on these factors.
The Future of BI Tools Beyond 2025
I believe that the future of BI tools is very bright indeed. In fact, it is coming into a period in which the data will not only be an indicator of what’s happening but an amber light for predicting the future and making real-time automatic decisions. Future BI platforms will be as follows:
- More intelligent because they will have embedded artificial intelligence and machine learning to do the hard work of heavy lifting.
- More integrated: they will seamlessly connect with other tools across cloud, ERP, CRM and collaboration platforms.
- Even more accessible than before, empowering everyone-not just the data teams to ask questions and gain insights.
- Real-time, with action-oriented dashboards becoming decision engines that trigger workflows automatically.
As technology continues to evolve, BI tools like Power BI and Tableau will play a central role in helping businesses stay agile, competitive, and truly data-driven.
Frequently Asked Questions on Power BI vs Tableau
Table of Contents